Integrating ABRT directly into your project with sABRTooth
ABRT is designed to only handle crashes on an operating-system level, i.e. it only handles packaged binaries by default and captures crashes coming from all of them. You might set up a blacklist, but that is rather tedious to get right if your only goal is to monitor the health of your own application.
FAF 2.2.0 released
A new version of FAF has just been released. From the user’s point of view, you will probably find the following changes the most noticable:
New releases
Just prior to branching of Fedora 32, we released new versions of abrt, gnome‑abrt, abrt‑java‑connector, libreport, satyr and retrace‑server.
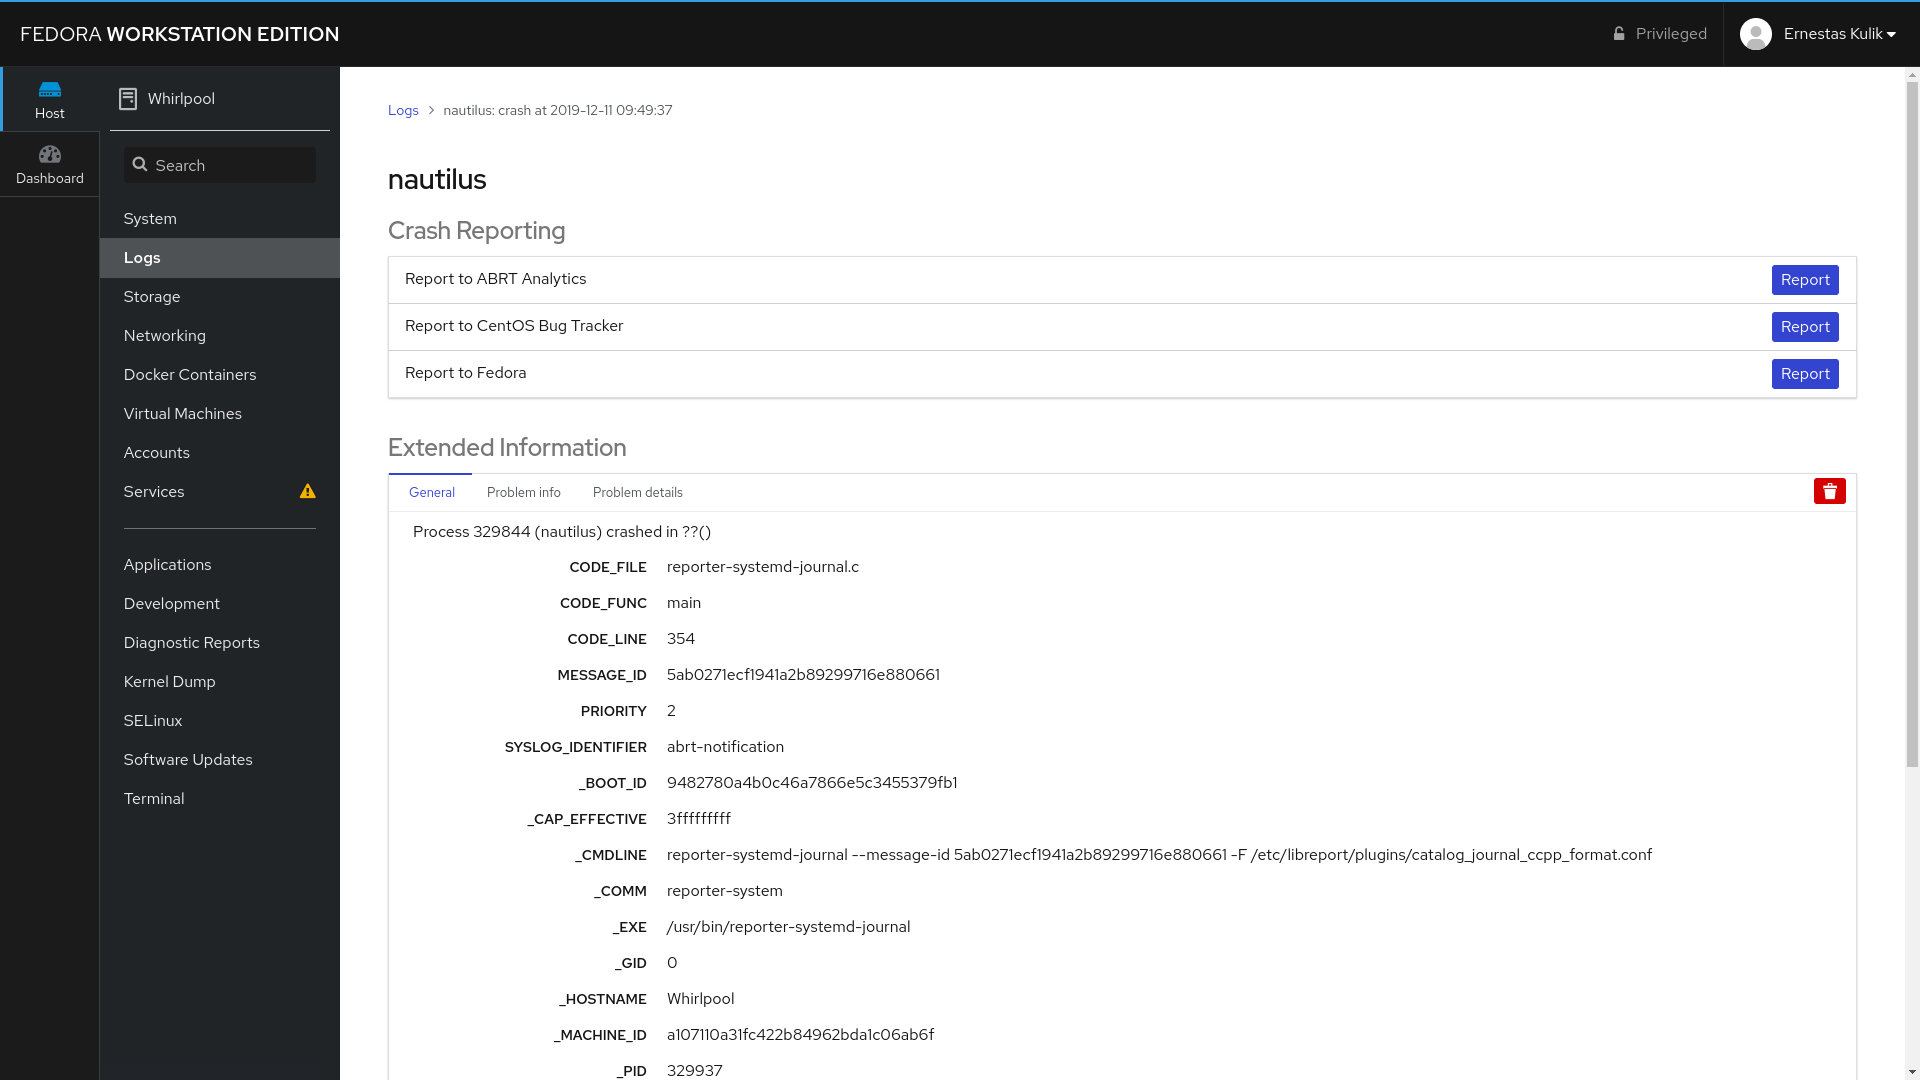
ABRT in Cockpit Redux
Starting with version 208, Cockpit features an improved crash-reporting experience:

ProcDump for Linux in Fedora
ProcDump is a nifty debugging utility which is able to dump the core of a running
application once a user-specified CPU or memory usage threshold is triggered. For
instance, the invocation procdump -C 90 -p $MYPID instructs ProcDump to monitor the
process with ID $MYPID, waiting for a 90 % CPU usage spike. Once it hits, it
creates the coredump and exits. This allows you to later inspect the backtrace and
memory state in the moment of the spike without having to attach a debugger to the
process, helping you determine which parts of your code might be causing performance
issues.